Welcome to the UIS Data Browser
The data browser allows users to view and filter data and metadata, visualize and share it or download it in various formats (csv, excel).
Browse DataKey facts
Only 44% of students
attain minimum proficiency in mathematics by the end of primary school.
Explore the indicator
In a fifth of countries with data
less than half of children are instructed in their first language
Explore the indicator
Latest data release
Education
Total data points: 8,299,411
Indicator count: 5,167
February 2026 Data Release
Indicator count: 5,167
February 2026 Data Release
Culture
Total data points: 3,923
Indicator count: 31
February 2026 Data Release
Indicator count: 31
February 2026 Data Release
Demography and Socio-Economics
Total data points: 329,921
Indicator count: 35
February 2026 Data Release
Indicator count: 35
February 2026 Data Release
Science, Technology and Innovation
Total data points: 20,072
Indicator count: 12
February 2026 Data Release
Indicator count: 12
February 2026 Data Release
Key features
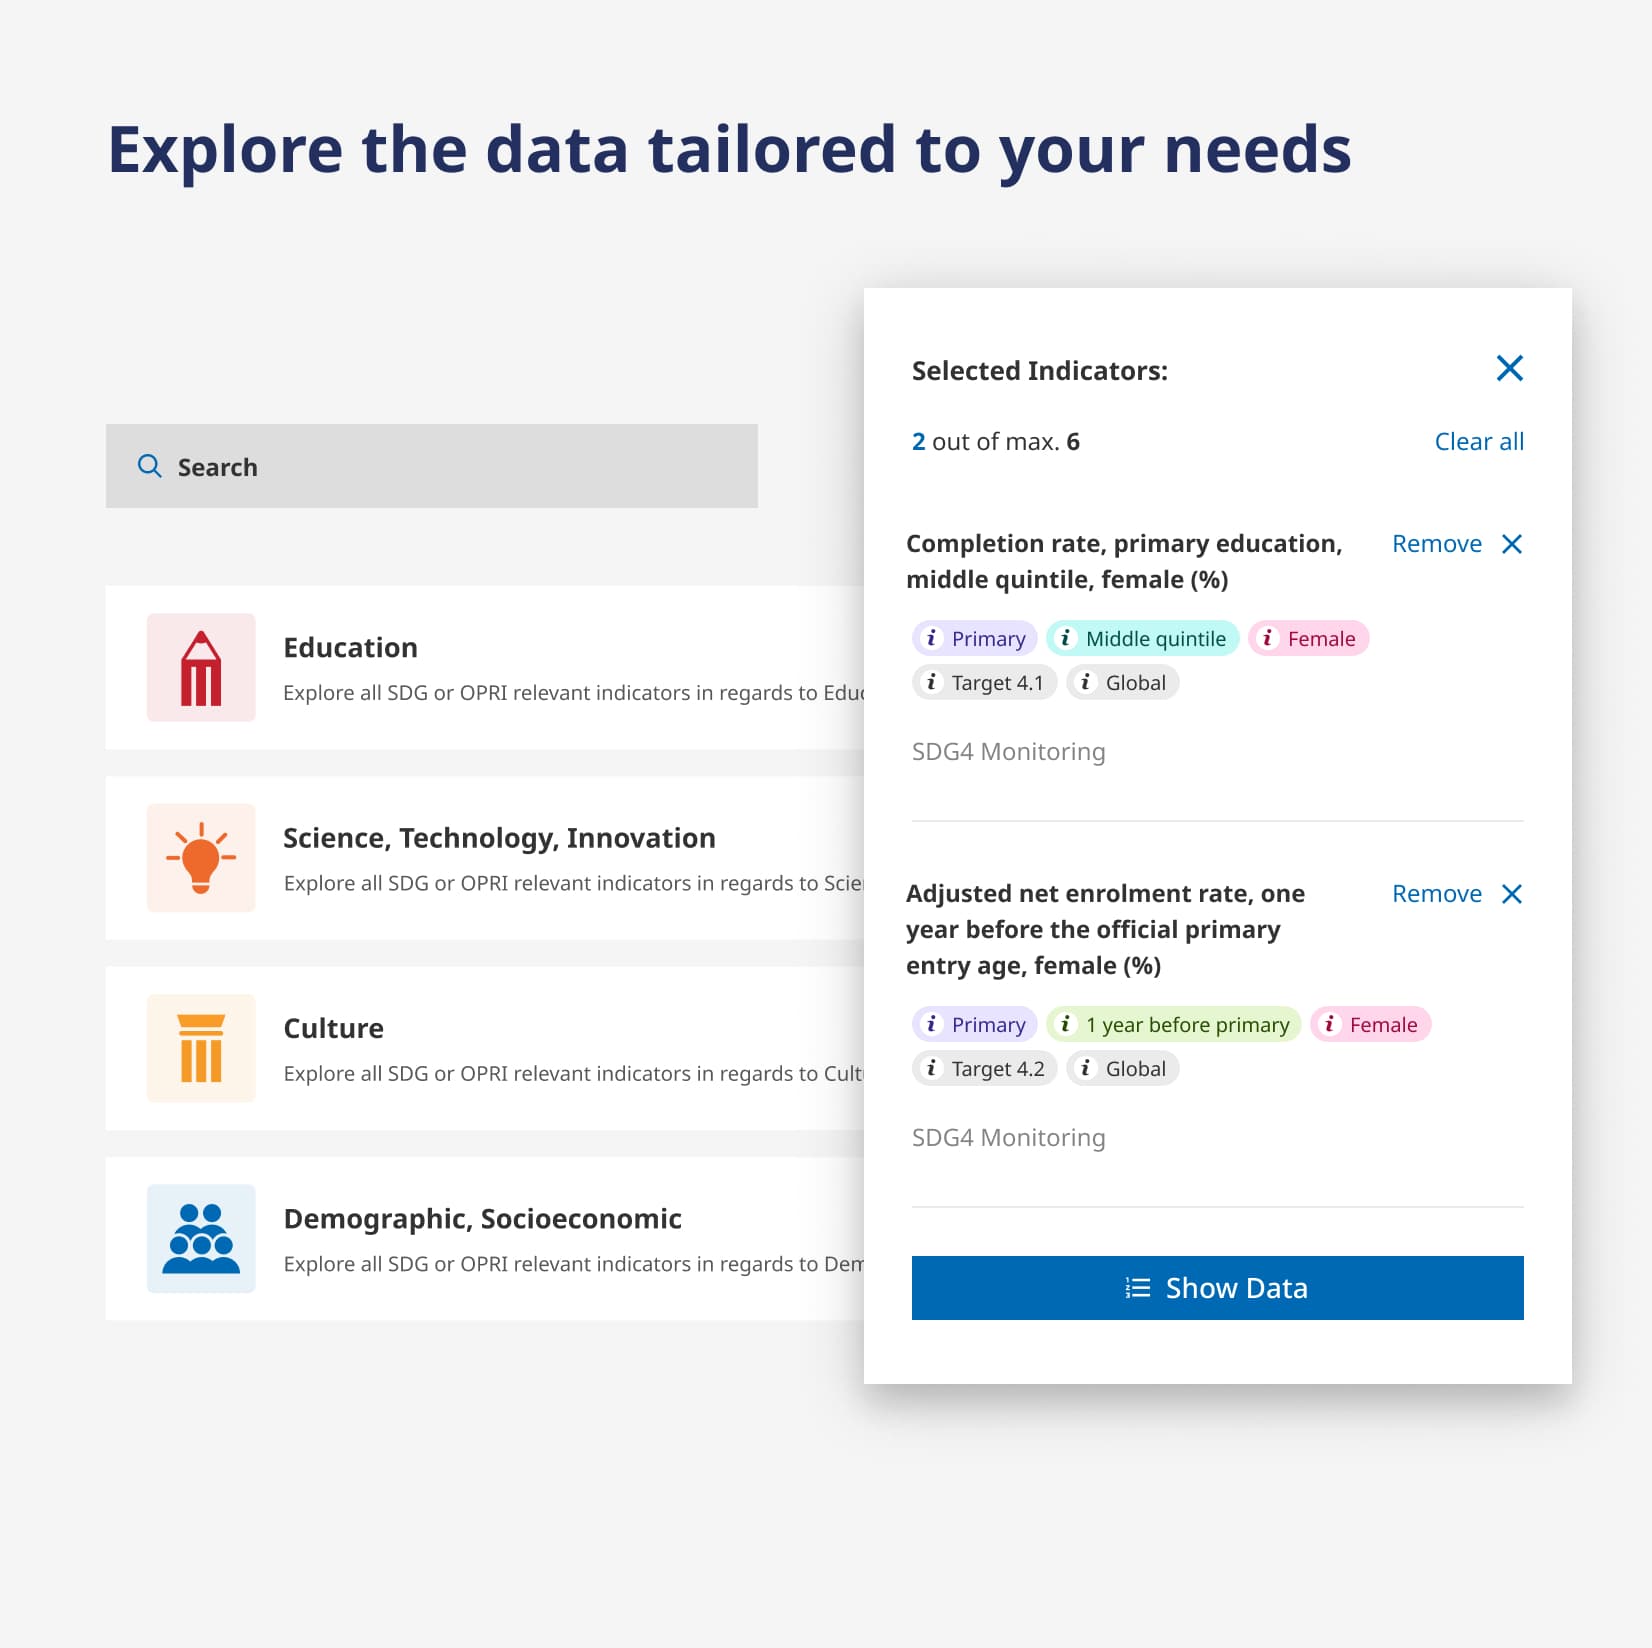
Discover
Select indicators
Browse for indicators in the field of Education, Science, Culture and Demographics and discover available disaggregations. Add indicators to your selection to investigate them further.
Gain insights
Visualize and customize
Filter selected indicators by country or region and visualize them using line or bar charts to gain more insights about their development and performance over time.
Explore
Evaluate metadata
Gain a deeper insight into the data by exploring the metadata provided for each selected indicator or browse through the glossary for terminology and definition.
Share and download
Share your query
Share your insights on social media or download the data with the applied filters for further analysis in different formats (csv, excel, json)